

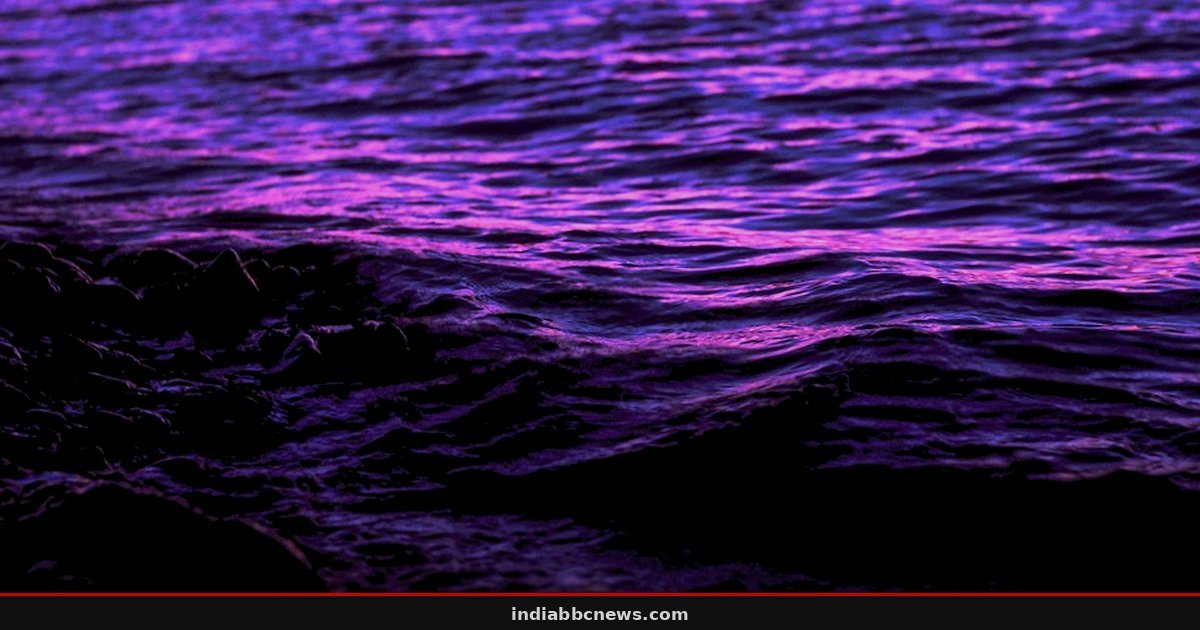
Waves off Imperial Beach pushed a plume of bright pink dye north at nearly eight miles per day, quickly carrying the simulated pollution toward the entrance of San Diego Bay.
This wasn’t an accident. It was a deliberate experiment conducted in October 2015 by researchers from the Scripps Institution of Oceanography. The goal was simple but difficult to achieve: visualize how pollutants move through the chaotic zone where ocean waves break. By turning a stretch of the Southern California coast pink, the team could finally see the invisible currents that dictate where sewage, oil, or debris ends up. The data, published in a 2021 study in the Journal of Geophysical Research: Oceans, reveals just how fast coastal contaminants can travel when the swell is right.
The Pink Plume: Tracking the Invisible
Pollution in the ocean is a ghost. Once it dissolves into the water column, it’s nearly impossible to track without expensive, invasive sampling. Dye solves that. It glows. It’s visible from the air. It’s a beacon in the blue.
The project, known as Cross-Surfzone/Inner-shelf Dye Exchange (CSIDE), was funded by the National Science Foundation. Derek Grimes, Falk Feddersen, and Sarah Giddings led the effort. They chose October 8, 2015, as their primary release date. About 0.6 miles north of Imperial Beach, they deployed instruments to monitor the water. Over four hours, they pumped in roughly 30 gallons of non-toxic, fluorescent pink solution. They tracked it for the next 30 hours. The instruments covered a four-mile stretch of coastline. The leading edge of the dye crossed that entire distance in roughly 11 hours. That speed is faster than a brisk walk, but for a passive pollutant, it’s a sprint.
Why the Water Moved North
Surf zone dynamics are counter-intuitive. Most people assume water just washes up the beach and back down. It’s more complicated. When waves approach the shore at an angle, they create a longshore current. This is the “rip” that runs parallel to the beach. In the 2015 experiment, the dominant swell was coming from the south. The waves hit the beach at a slant, pushing the surface water—and the pink dye—northward.
“The dye moved north in the direction predicted by the incoming waves,” the study notes. This meant that anything released in that swell would be driven directly toward the San Diego Bay entrance. The route is clear. The timing depends on the weather. A strong south swell doesn’t just roughen the seas; it acts as a conveyor belt for coastal contamination.
But the story doesn’t end at the shoreline. The data showed a split in behavior. In the surf zone, where the waves are breaking, the flow was north. Further out, beyond the breaker line, currents moved slowly south. This creates a complex loop. The dye lingered near the coast, bouncing between the northward push of the surf and the slower, southward pull of the inner shelf. It’s a trap for pollutants. They don’t just disappear into the deep ocean immediately. They hang around the coast, mixing with beachgoers and marine life, for hours or days.
The Rapid Fade: From Bright to Invisible
How fast does the concentration drop? Faster than you’d think. At the release point, the dye concentration peaked at about 90 parts per billion. Just four miles further up the coast, it fell to under 5 parts per billion. That’s a 94% drop in concentration over a short distance.
The primary culprit isn’t just dilution. It’s rip currents. These strong, narrow channels of water flowing out to sea act like drains. They pull the dye away from the shore and into the deeper inner shelf, where it mixes with a larger volume of water. The study attributes much of the rapid thinning to these outflowing currents. The dye wasn’t just spreading out; it was being sucked away from the beach area entirely.
One detail stands out from the field notes. The researchers noted that the dye’s visibility allowed them to see the exact moment the leading edge hit the boundary of the surf zone. It wasn’t a gradual fade. It was a sharp line, a pink wall moving against the blue. That visual clarity is what makes dye experiments so valuable. You can’t see a plume of microplastics. You can see a plume of dye. And you can measure its speed in real-time.
What Comes Next for Coastal Monitoring
This 2015 data isn’t just a historical curiosity. It informs how we model pollution events today. When a sewage spill happens, or when an oil slick is detected, models need to account for this rapid northward transport during south swells. The next major step is integrating these real-time dye observations into operational forecasts. Agencies like the National Oceanic and Atmospheric Administration (NOAA) are working to incorporate such data into their coastal prediction systems. The goal is to predict where the “pink” will be before it gets there. This isn’t science fiction. It’s the next phase of applying 2015’s data to 2026’s challenges. The decision points for local emergency managers will hinge on these precise speed and direction metrics.
Frequently Asked Questions
Was the pink dye toxic to marine life?
No. The dye used in the CSIDE experiment was non-toxic and specifically chosen for its visibility and safety in the marine environment. It was a fluorescent tracer, not a chemical pollutant.
How fast does pollution typically move along the California coast?
According to the 2015 study, under strong south swell conditions, surface pollutants can move north at nearly eight miles per day. However, speeds vary significantly based on wave angle, swell direction, and local currents. In calm conditions, movement is much slower.
Source: Hindustan Times World
This article was compiled by the IndiaBBCNews editorial system from verified international news sources. Facts have been independently reviewed. Original reporting: Hindustan Times World.